Posted on Sep 25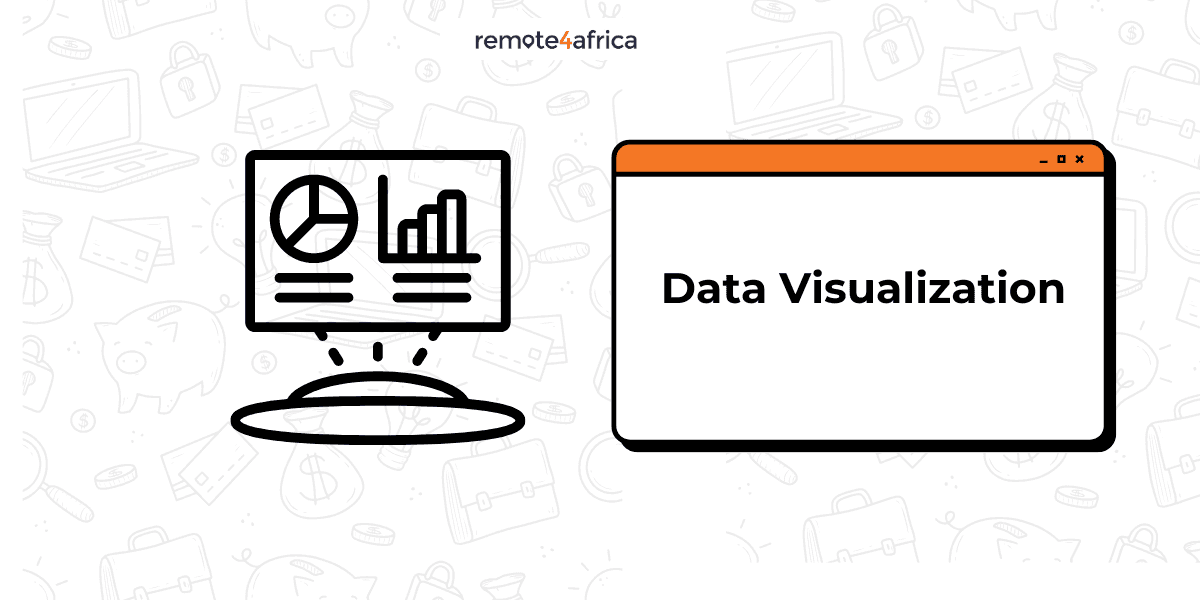
Data Visualization is the graphical representation of information and data. The art of presenting data and information as graphs, charts, or maps is known as data visualization. By using visual elements like charts, graphs, and maps, data visualization tools provide an accessible way to see and understand trends, outliers and patterns in data.It plays a crucial role in fields such as business analytics, scientific research, and journalism, where conveying information quickly and accurately is essential. It helps to:
The data visualization process typically involves several key steps:
1. Define Objectives: Determine the purpose of the visualization. What questions are you trying to answer?
Data visualization is highly relevant across various careers, as it enhances the ability to communicate complex information clearly and effectively. Here are a few popular careers where data visualization plays a key role:
In conclusion, Data Visualization plays a crucial tool for interpreting complex datasets and conveying insights effectively. It transforms raw data into visual formats, making it easier to identify patterns, trends, and anomalies. By enhancing comprehension and retention, effective visualizations empower decision-makers and foster better communication across disciplines. As data continues to growin volume and complexity, mastering data visualization techniques will remain essential for leveraging information in meaningful ways.
Detailed Overview of Data Visualization and its Career Relevance
Visualization has become an integral aspect of data analysis in today's data-driven environment. This article will examine everything you need to know about data visualization.
What is Data Visualization?
Data Visualization is the graphical representation of information and data. The art of presenting data and information as graphs, charts, or maps is known as data visualization. By using visual elements like charts, graphs, and maps, data visualization tools provide an accessible way to see and understand trends, outliers and patterns in data.It plays a crucial role in fields such as business analytics, scientific research, and journalism, where conveying information quickly and accurately is essential. It helps to:
● Simplify complex data
● Identify trends and patterns
● Make data-driven decisions
● Communicate insights effectively
Some Types of Data Visualization
- Bar chart: To compare data along two axes, use bar charts . A visual representation of the categories or subjects being measured is shown on one of the axes, which is numerical.
- Column Chart: They are a straightforward, time-tested method of comparing several collections of data. A column chart may be used to track data sets across time.
- Line Graph: A line graph is used to show trends, development, or changes through time. As a result, it function best when your data collection is continuous as opposed to having many beginnings and ends.
- Pie Chart: Represents parts of a whole as slices of a circle. Each slice corresponds to a category's contribution to the total , but can be less effective for precise comparisons.
- Histogram: Similar to a bar chart but used for continuous data. It displays thefrequency distribution of numerical data by dividing it into bins.
Data Visualization Process
The data visualization process typically involves several key steps:
1. Define Objectives: Determine the purpose of the visualization. What questions are you trying to answer?
2. Data Collection: Gather the relevant data from various sources. Ensure it is accurate and up-to-date.
3. Data Cleaning: Process the data to remove inaccuracies,duplicates, and irrelevant information. Standardize formats if necessary.
4. Data Exploration: Analyze the data to understand its structure, trends, and patterns. This may involve using statistical methods.
5. Choose Visualization Type: Select the appropriate visualization method(e.g ., bar charts, line graphs, scatter plots) based on the data and the objectives.
6. Design the Visualization: Create the visual representation, paying attention toclarity,color schemes, labels, and legends. Aim for simplicity and effectiveness.
7. Interpret Results: Analyze the visualizations to draw insights and conclusions relevant to the original objectives.
8. Iterate and Refine: Gather feedback and make adjustments as needed to improveclarity and effectiveness.
9. Share and Communicate: Present the final visualization to the intended audience, ensuring the content and insights are clearly communicated.
10. Review and Update: Periodically review the visualization to ensure it remains relevant with any new data or changing activities.
Career Relevance
Data visualization is highly relevant across various careers, as it enhances the ability to communicate complex information clearly and effectively. Here are a few popular careers where data visualization plays a key role:
Analyzes data sets and presents findings using visual tools to inform business strategies.
● Business Intelligence Analyst
Focuses on interpreting complex data through visual dashboards to support decision-making processes.
Utilizes visualization techniques to explore data,derive insights, and communicate results effectively.
● Data Journalist
Combines journalism and data analysis, creating visual stories that highlight important trends and issues.
Applies data visualization principles to design intuitive user interfaces that convey information clearly.
● Marketing Analyst
Uses visualization to track campaign performance, customer behavior, and market trends.
Skills To Acquire
- Technical Skills: Proficiency in data visualization tools and programming languages(e.g , R, Python)
- Analytical Skills: Ability to interpret data and derive actionable insights.
- Design Skills: Understanding of visual design principles to create appealing and effective visuals.
- Communication Skills: Ability to explain complex data findings clearly and concisely.
Conclusion
In conclusion, Data Visualization plays a crucial tool for interpreting complex datasets and conveying insights effectively. It transforms raw data into visual formats, making it easier to identify patterns, trends, and anomalies. By enhancing comprehension and retention, effective visualizations empower decision-makers and foster better communication across disciplines. As data continues to growin volume and complexity, mastering data visualization techniques will remain essential for leveraging information in meaningful ways.
Remote Jobs for Data Visualization
Jun 04
Related Resources